
- John Wannamaker
- 13 Mar 2022
- 16 Comments
Abstract
After making a post in fall of 2021 on carp fishing statistics which generated quite a bit of interest on CCS, I did more digging on stats and reviewed the data generated to date. The article below is mostly a copy/paste of the first revision post/data/estimations, with some additional refinements made and sections added. I talked quite a bit with some folks in data science since the first post on carp fishing stats and brought their ideas into the analysis, which is reflected in the below.
Purpose
Determine the relationship between carp weight and percent likelihood of capture for fish in the range of 40-50 lb.
Too Long Didn’t Read (TLDR)
The math says you need to catch around 1000 fish to get one over 50 lb in Southern Ontario! Skip to the Discussion section if you’re tight on time.
Introduction
[In 2021] I spent a lot of time on the bank thinking about how I can catch the biggest fish possible, like most of us do. After playing around (quite unsuccessfully) trying to target big fish using larger baits and fishing at big water venues, I started to develop the theory that carp fishing in Ontario is a game of statistics, where you simply need to catch as many fish as possible to wade through the average size carp in order to catch the giants. I theorized that statistics can be used to predict the percent likelihood of capture of the really big fish (and also the mirrors), and therefore tell you how many fish you need to catch in order to land something in the 30, 40, and even 50 lb range.
Methods
The data used to generate the plots in the below Results section is a sample size of 278 fish caught by the CornStars over the 2020 and 2021 season at a variety of venues in Bruce, Prince Edward, Wellington, Hamilton, and Northumberland counties. This sample size is not specific to a certain body of water, and represents an average Southern Ontario venue. All 278 fish were caught using “traditional” carp angling methods (rod pod, hair rig, carp rod/reel, prebaiting swims, fishing during May-September, corn or boilies as hookbait and method mix on the coil lead) for Ontario and carried out by intermediate skill level anglers.
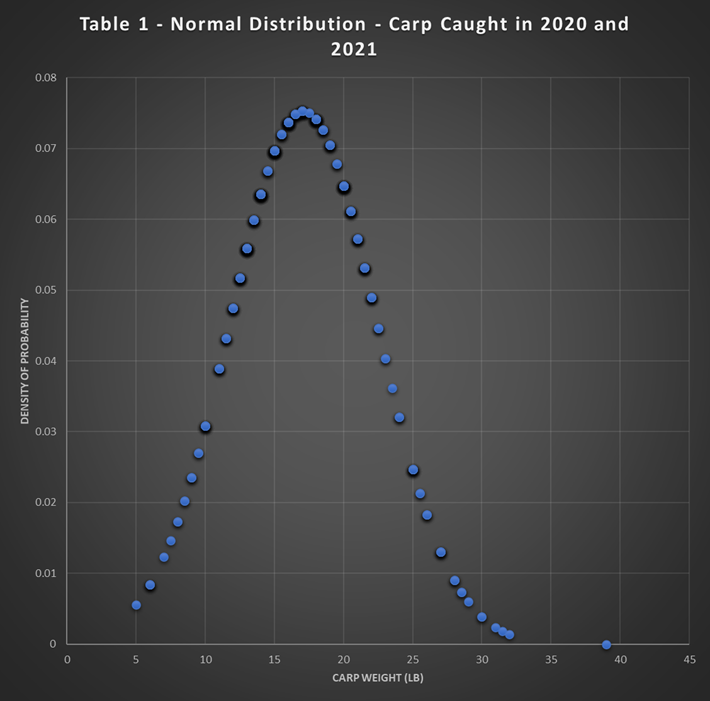
Going into this experiment I had assumed that the fish weight would follow a Normal Distribution, which turned out only to be accurate for predicting fish weight within ~1.5 standard deviations from the mean. At the extremes of the distribution the estimated weights did not match well with my sample size, leading to the estimated percent likelihood of capture of the 30-50 lb range fish appearing to be unreasonable. The fact that the normal distribution did not represent the sample accurately could be due to a number of reasons like small sample size, skewed sample size (biased right hand), or the fact that the weight of carp caught simply does not follow this pattern. I also tried fitting the weights to a few polynomial functions but none of the trends seemed reasonable, even near the mean.
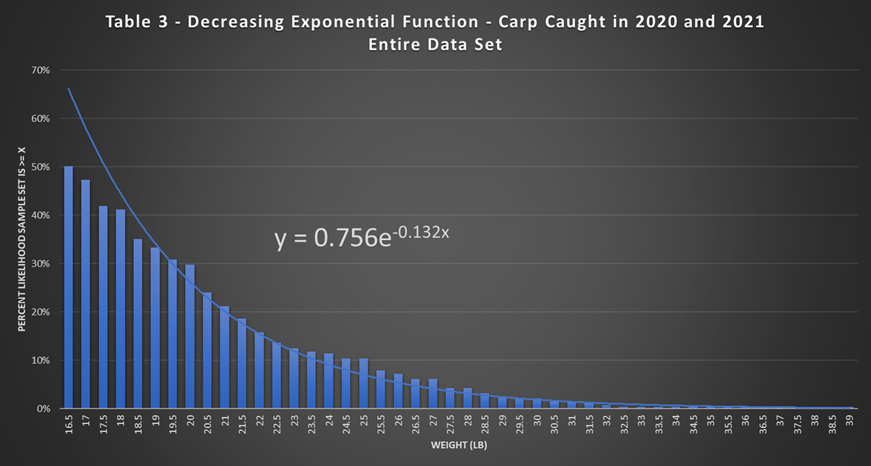
I fit a decreasing exponential function to the percent likelihood of capture for weights greater than the mean, and the function appeared to generate reasonable results within the sample size. It also generated believable numbers when extrapolated to up to the 50 lb range. In order to better test if the decreasing exponential function was the best model for extrapolating weights, the data set was divided into two (even and odd number captures).
Results
Empirical data was used to interpolate percent likelihood of capture for mirror carp and carp with weights 20-35 lb. The empirical interpolations are based on the sample of 278 fish caught in 2020-2021 in Southern Ontario using traditional basic euro style tactics:
Key Metrics from Empirical Data
Mirror Percentage 1.08%
Percent Fish >= 20 lb 29.86%
Percent Fish >= 25 lb 10.43%
Percent Fish >= 30 lb 2.16%
Percent Fish >= 35 lb 0.36%
Number of Fish needed to get a Mirror = 93
Number of Fish needed to get a fish >= 20 lb = 3.3
Number of Fish needed to get a fish >= 25 lb = 9.6
Number of Fish needed to get a fish >= 30 lb = 46.3
Number of Fish needed to get a fish >= 35 lb = 278.0
Extrapolated Data – Normal Distribution (Table 1)
Curve of Best Fit function y = 0.756e-0.132x
Percent Fish >= 40 lb 0.0007632435%
Percent Fish >= 45 lb 0.0000068779%
Percent Fish >= 50 lb 0.0000000261%
Number of Fish needed to get a fish >= 40 lb = 131019.7926
Number of Fish needed to get a fish >= 45 lb = 14539328.93
Number of Fish needed to get a fish >= 50 lb = 3826178543
Extrapolated Data – Exponential Function (Table 3) Entire Data Set
Curve of Best Fit function y = 0.756e-0.132x
Percent Fish >= 40 lb 0.3849877679%
Percent Fish >= 45 lb 0.1989814416%
Percent Fish >= 50 lb 0.1028438236%
Number of Fish needed to get a fish >= 40 lb = 259.7
Number of Fish needed to get a fish >= 45 lb = 502.6
Number of Fish needed to get a fish >= 50 lb = 972.3
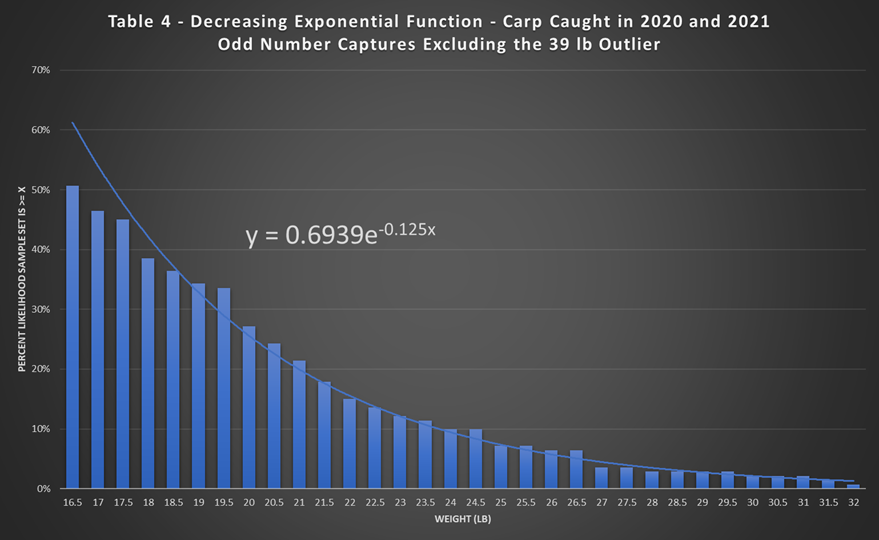
Extrapolated Data – Exponential Function (Table 4) Odd Number Captures
Curve of Best Fit function y = 0.6939e-0.125x
Percent Fish >= 40 lb 0.4675461423%
Percent Fish >= 45 lb 0.2502594160%
Percent Fish >= 50 lb 0.1339542125%
Number of Fish needed to get a fish >= 40 lb = 213.9
Number of Fish needed to get a fish >= 45 lb = 399.6
Number of Fish needed to get a fish >= 50 lb = 746.5
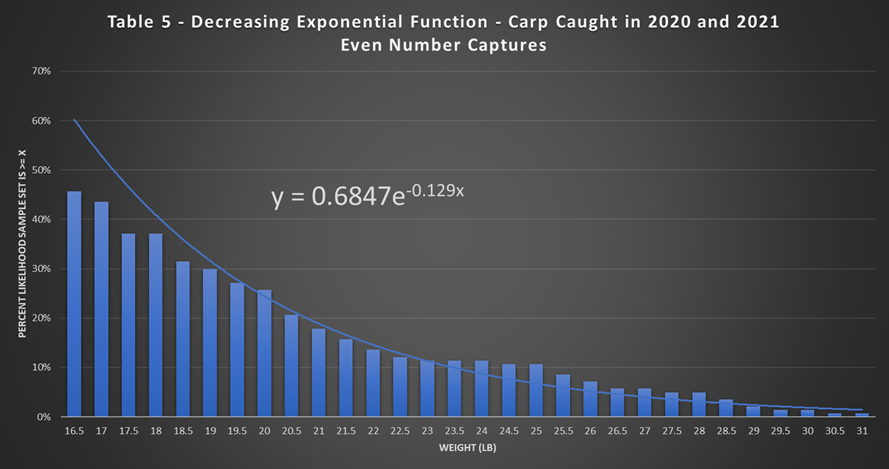
Extrapolated Data – Exponential Function (Table 5) Even Number Captures
Curve of Best Fit function y = 0.6847e-0.129x
Percent Fish >= 40 lb 0.3931341775%
Percent Fish >= 45 lb 0.2062627769%
Percent Fish >= 50 lb 0.1082183529%
Number of Fish needed to get a fish >= 40 lb = 254.4
Number of Fish needed to get a fish >= 45 lb = 484.8
Number of Fish needed to get a fish >= 50 lb = 924.1
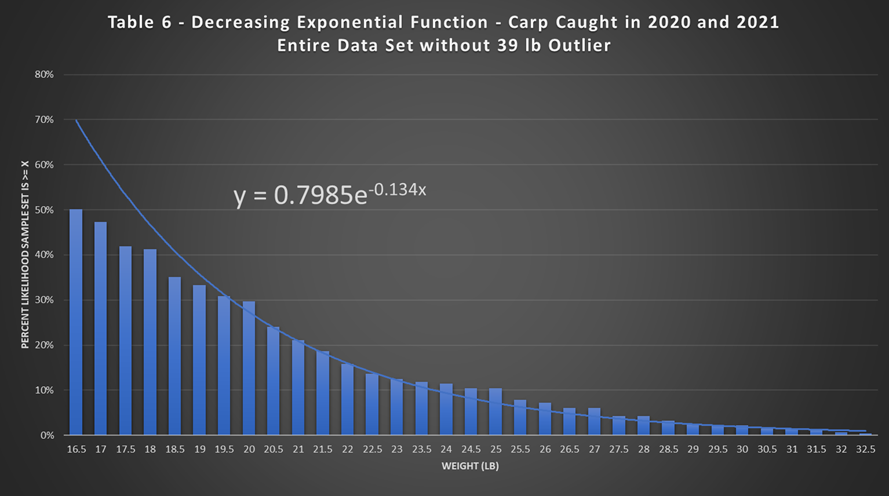
Extrapolated Data – Exponential Function (Table 6) Entire Data Set without the 39 lb Outlier
Curve of Best Fit function y = 0.7985e-0.134x
Percent Fish >= 40 lb 0.3753673527%
Percent Fish >= 45 lb 0.1920786942%
Percent Fish >= 50 lb 0.0982883154%
Number of Fish needed to get a fish >= 40 lb = 266.4
Number of Fish needed to get a fish >= 45 lb = 520.6
Number of Fish needed to get a fish >= 50 lb = 1017.4
Discussion
Based on the empirical interpolated data, 1.08% of carp caught in Southern Ontario are mirror carp. This means that you will need to catch 93 carp to get one mirror capture. For common carp, 10.43% fish caught are greater than or equal to 25 lb, and 2.16% are greater than or equal to 30 lb, meaning that you will need to catch 10 fish to catch a carp greater than or equal to 25 lb, and 47 to catch one greater than 30 lb.
The most reasonable/believable extrapolated estimation for the number of fish needed to catch a fish greater than or equal to 45 lb is 521 fish. The number of fish needed to catch a fish greater than or equal to 50 lb is 1018 fish.
I’m having dreadful flashbacks to statistics class at the moment. I can remember how much I hated the way the prof said secant right now. I am a little sad at how short sighted I was in school because this is actually fascinating. There must be more to this though. I’m not saying this is wrong, just a starting point for speculation. I know a few anglers that have likely caught 1000 carp in their lifetimes and nobody speaks of a known 50 on the mat. It would be interesting to see if we head south a few degrees of latitude and see if and how this curve shifts.
100% agree on everything you mentioned here. This is my best guess at how many fish are needed to in order to get something in the trophy range, but at the end of the day it is just a guess. There is likely an upper limit to what is possible in Southern Ontario, and other variables with different amounts of statistical significance like time of year, depth, location, etc that the charts above do not consider.
I’d love some input on if you find the predictions reasonable, as this is by no means a final revision.
Interesting analysis, and it confirms empirical observations. I fished the St. Lawrence a couple of times where an Englishman named Bernie Haines had a carp charter business. He said he chose the St. Lawrence because in addition to being big water with a lot of carp, it also had a lot of big predators like pike and muskies. The predators helped reduce the population of smaller carp, which he said helped the survivors to grow bigger and improved the ratio of fish over 20 pounds.. And I visited a lake in France where anglers from all over Europe came to try to catch fish over 40 pounds. The lake’s owner was awaiting a truckload of 20-pound-plus carp from Yugoslavia, along with a shipment of Eurasian wels catfish over 50 pounds. He said the job of the catfish was to eat the carp under 15 pounds. I never caught a huge carp there but saw some that exceeded 40 pounds. I suspect that no matter how skilled a carp angler is in North America, there’s more luck involved in catching a fish over 30 pounds simply because there is such a huge population of smaller carp competing for the bait. What has also fascinated me is how few fish I catch that are under 5 pounds. That may be a product of fishing in places tha juveniles avoid.
Agreed with you where it seems like since carp are so prolific and unpressered in North America it feels like you need to wade through significant numbers of fish near the mean weight to catch bigger fish. I’ve tried and failed to target the large fish by changing baits and tactics so I just try to catch as many as possible now. Interesting note on predator control to improve to fishery. I wonder if harvest of sub average Commons here would produce bigger fish or if any harvest of this invasive species would be negligible on their overall population or mean weight.
Interesting read for sure. I hate math. My head hurts!! Great data for sure, and there’s something to this. The only known 50s I am aware of came from the St. Lawrence.
Dude I hated stats in uni lol, but if I can be used to help win some SSFs I’m all in!
Very interesting Intel on the st. L 50. Do you have any more info on that? I’m super curious.
I would love to see this data and research applied to specific locations. If there is a way to set up specific individuals to track data in their respective areas and then calculate after the season, we could pinpoint where that next huge fish may be likely to come from. IF people want their spots to get that kind of attention. But from a research perspective, predicting the region of the next monster could be really cool.
Thanks for the input here John. As mentioned in some of the other comments, I only collected data on catch rate and date in my sample size of 278 fish, but there are thousands of potential variables (wind direction, pre/post spawn, bait, etc) with varying degrees of statistical significance like location that you pointed out. Recording all of this info and analysing it would likely be the best way to identify the location/conditions required to maximize the likelihood of landing a trophy fish.
So your telling me there is a chance 😁
Nice one John! I admire the dedication and the stats knowledge. Keep this type of content coming!
Hey man I was as curious as you were that’s why I put this together! Just trying to see how many fish I need to catch to get a monster. Cheers brutha! More to come on this in the future. It’s still very mush a work in progress.
Very interesting stuff. I love documenting catches, it really helps to get an understanding on what’s actually out in our waters here in Canada.
I was really impressed last year in the amount of data we collected and recorded for the URC page. I often think about expanding it to include more but that would be a lot of work.
An idea I had for this year was to create a shared google sheet. Each member that wanted to participate could log their own catches throughout the year.
Would anyone be interested in something like this? (Great article John, thanks so much for sharing.)
Great idea on the shared Google sheet Nathan. Having a larger sample size to draw extrapolated or interpolated data from would improve the potential accuracy of estimating fish catch weights. If something like this was done, it would be important for all participating anglers to log every single catch in order to avoid skewing the results and introducing error. As mentioned in the comments above, there are likely other variables of high statistical significance like time of year (aka prespawn), wind direction (fishing the windward bank) that could be used to refine the data and point to conditions that produce the trophy fish. There are thousands of potential variables that could be recorded, and there are techniques that can be used to determine which are most statistically significant.
Great read . !!!
Cheers mate!
An application of Bayesian statistics and prevalence seems necessary in the very least.
e.g.: If you catch 10,000 carp from a small, overpopulated lake, you’ll never get a 50 simply because there isn’t one there; egg mass in spring can add 20% to body weight – a 40lb prespawn female might weigh 33lbs in August; in April through June, fishing is easy, plentiful, and accessible – do I have to catch 1000 fish all year or 1000 fish in these three months to get that 50?; one or two focused, high-functioning anglers can skew results from the expected value. These variables need to be accounted for, and doing so is extremely difficult if not impossible.
I don’t think that stats in the sense of simple catch reporting can be meaningfully applied in fishing – significant population data of uncaught fish is necessary, comparisons of techniques, controls in terms of rig-hook-bait combinations, and so on. I believe this study to be underpowered. Your work however is interesting and appreciated.
Thanks for the input here Christopher. Appreciate the constructive feedback a lot. I agree completely that this is a very simplified “best guess” at how many fish are required to get a trophy in Southern Ontario. Many simplifying assumptions were made that may or may not be responsible or validated. As mentioned in previous comments above, this estimation ignores other all other variables which likely have high statistical significance in terms of predicting trophy catches (like wind direction, pre/post spawn conditions, etc). There are thousands of variables in fishing and compiling and sorting out the data would take significant work. Thanks for the input though, this is definitely a rev 1 and need more refinement in order to have a reasonable level of confidence in the results.
Are you good with stats? Do you agree with the approach I used to try to figure this one out? Would love some feedback if you have suggestions for improvement.